Dashboards
SciPy 2024: Unlocking Dynamic Reproducible Documents
A Quarto Tutorial for Scientific Communication
Duke University + Posit PBC
Anatomy of a Quarto dashboard
Components
Metadata: YAML
Text: Markdown, likely placed in cards
Code: Executed via
jupyter(orknitr), automatically placed in cards
Weave it all together, and you have a beautiful, functional dashboard!
Out turn: Dashing through the snow
Let’s review the components of hello-penguins-dashboard.qmd.
Notebook ➝ Dashboard
Dashboard Components
Navigation Bar and Pages — Icon, title, and author along with links to sub-pages (if more than one page is defined).
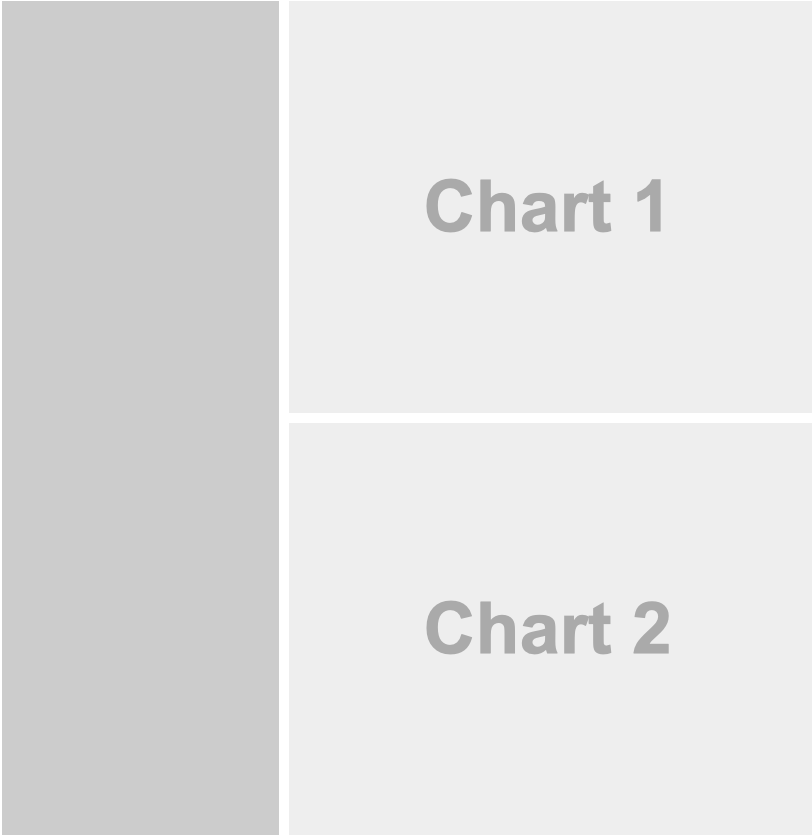
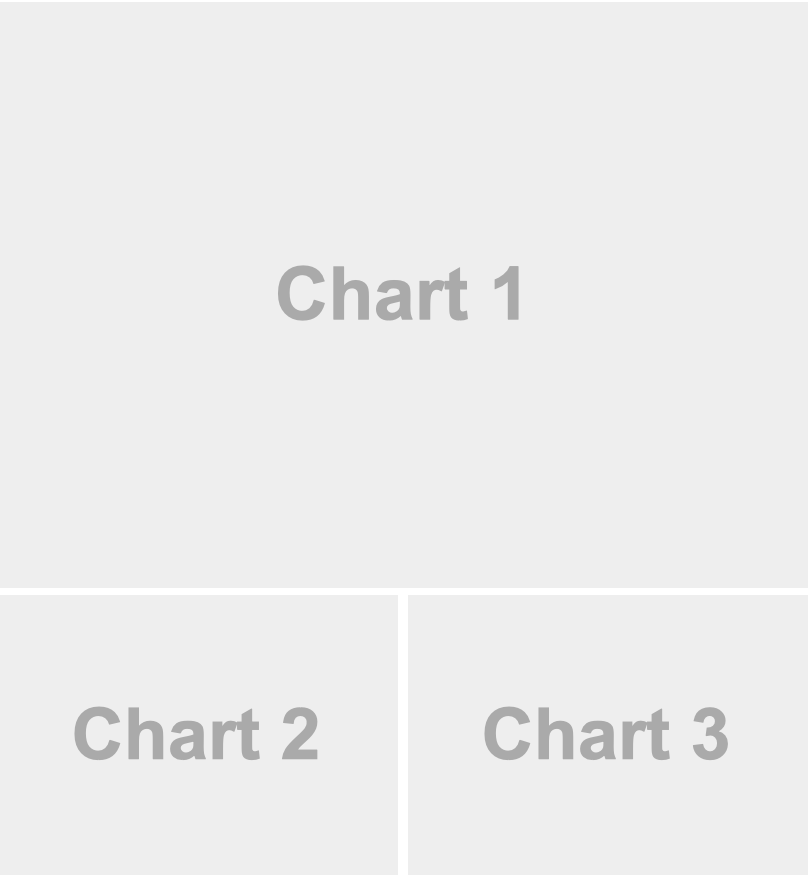
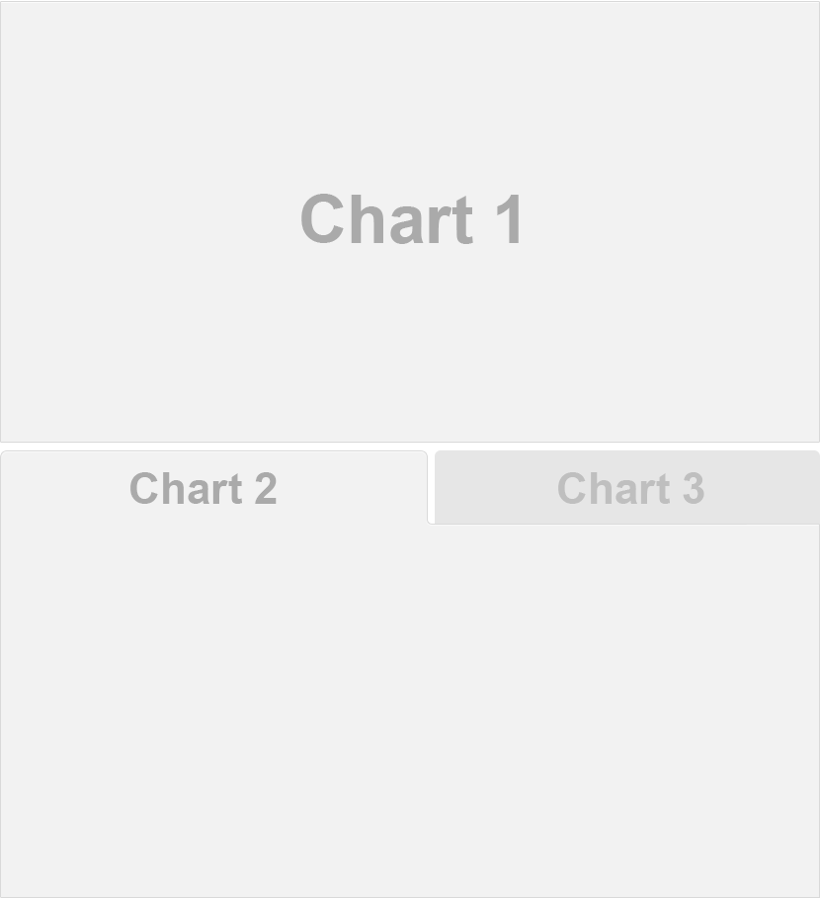
Sidebars, Rows & Columns, and Tabsets — Rows and columns using markdown heading (with optional attributes to control height, width, etc.). Sidebars for interactive inputs. Tabsets to further divide content.
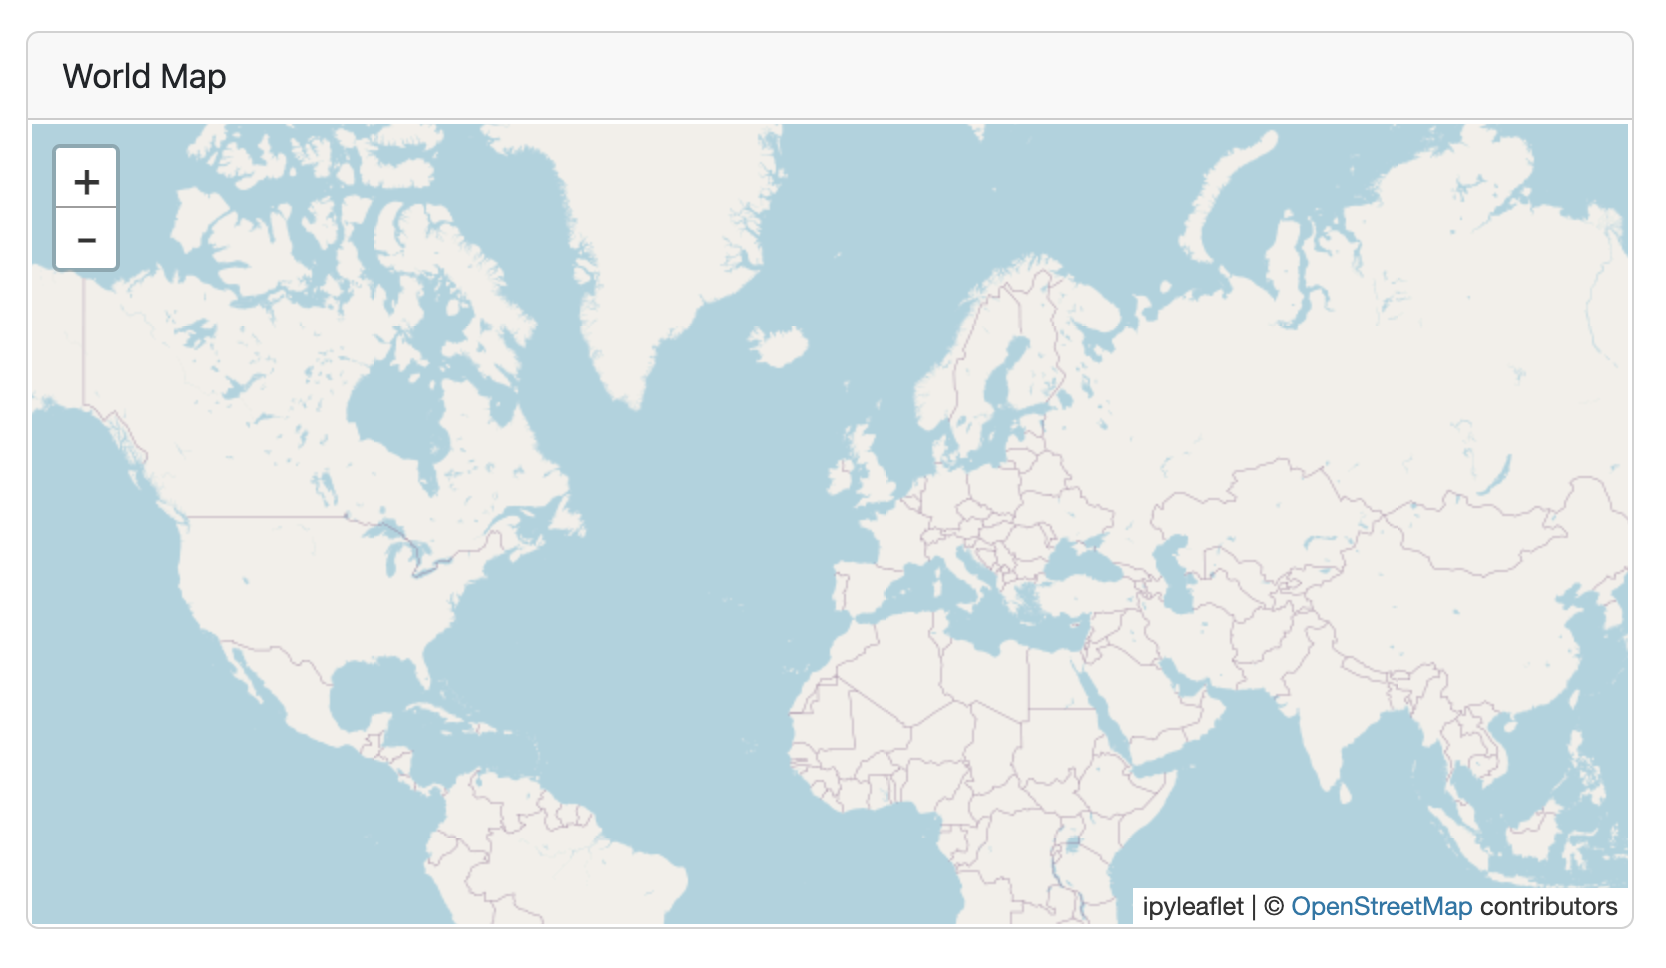
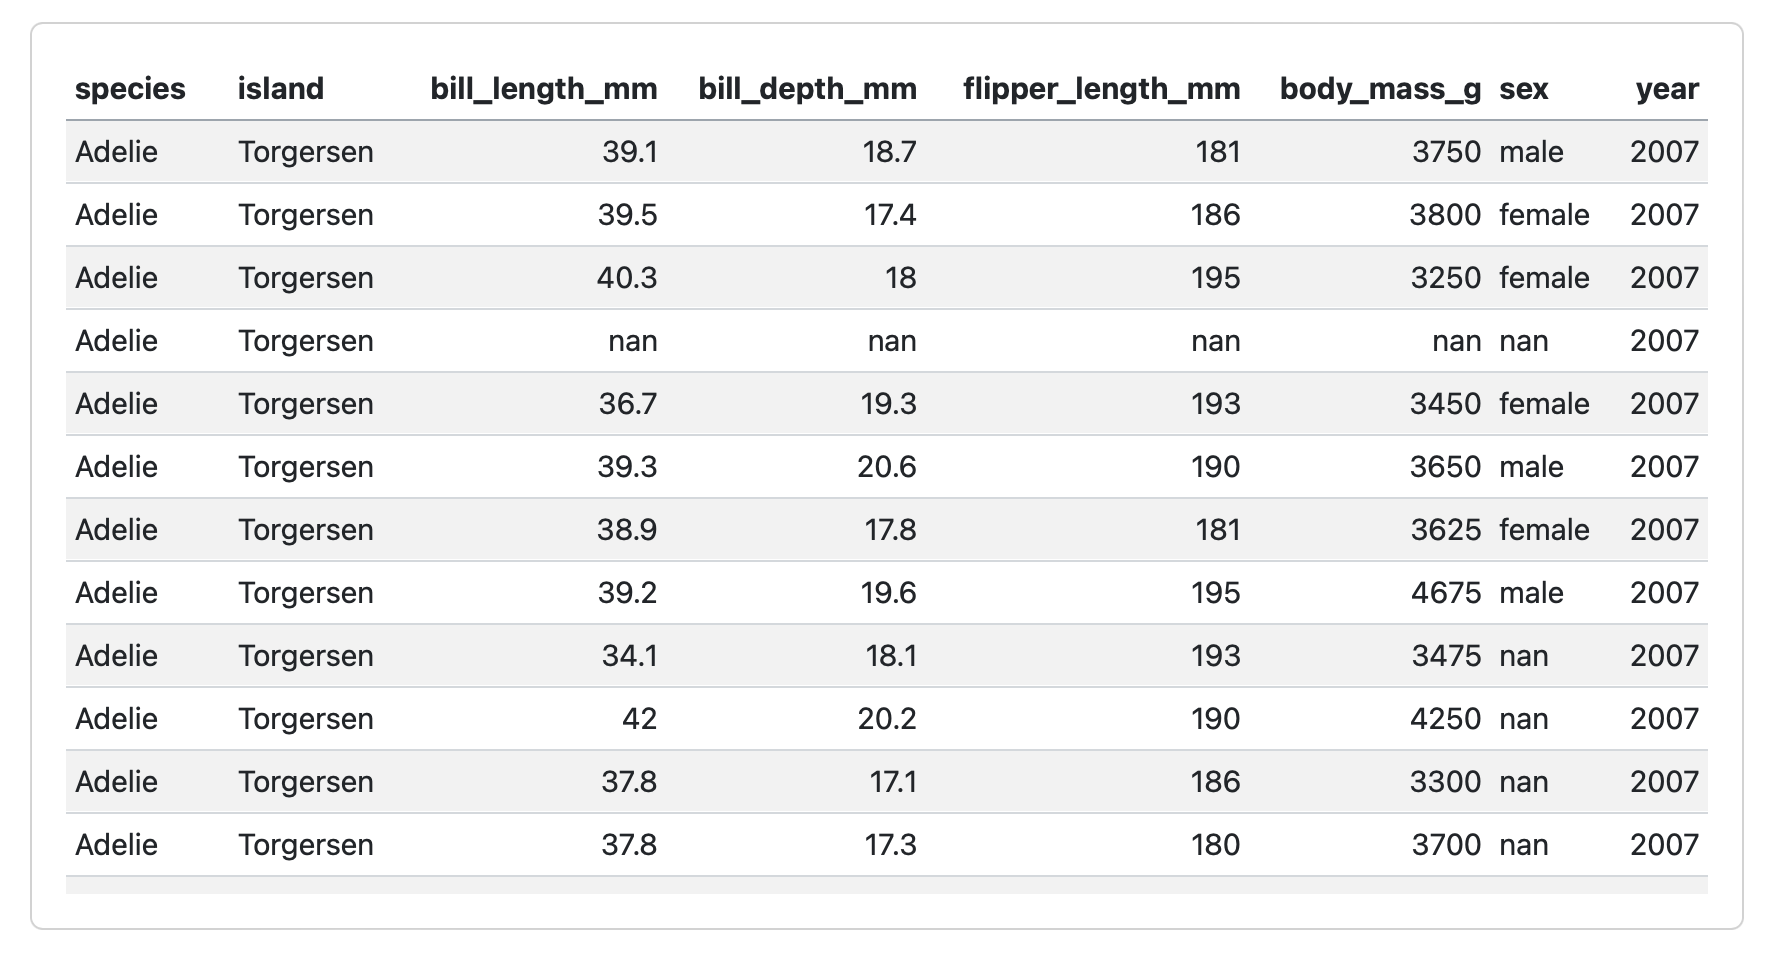
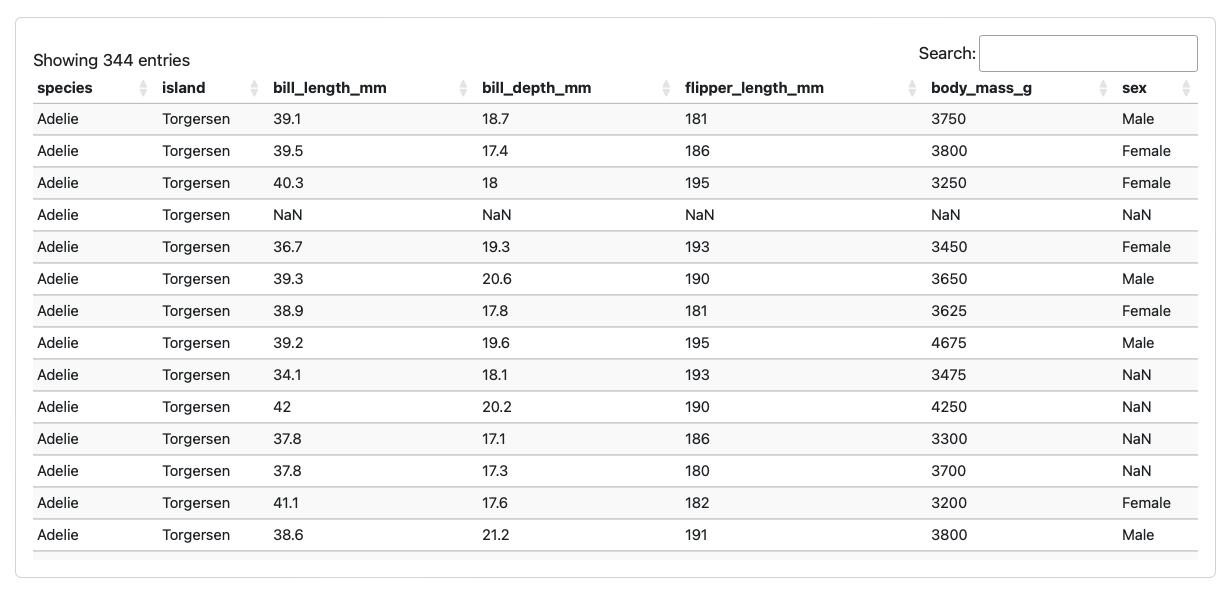
Cards (Plots, Tables, Value Boxes, Content) — Cards are containers for cell outputs and free form markdown text. The content of cards typically maps to cells in your notebook or source document.
All of these components can be authored and customized within notebook UI or plain text qmd.
Navigation Bar and Pages

Sidebars: Page Level
Sidebars: Global
Layout: Rows
Layout: Columns
Tabsets
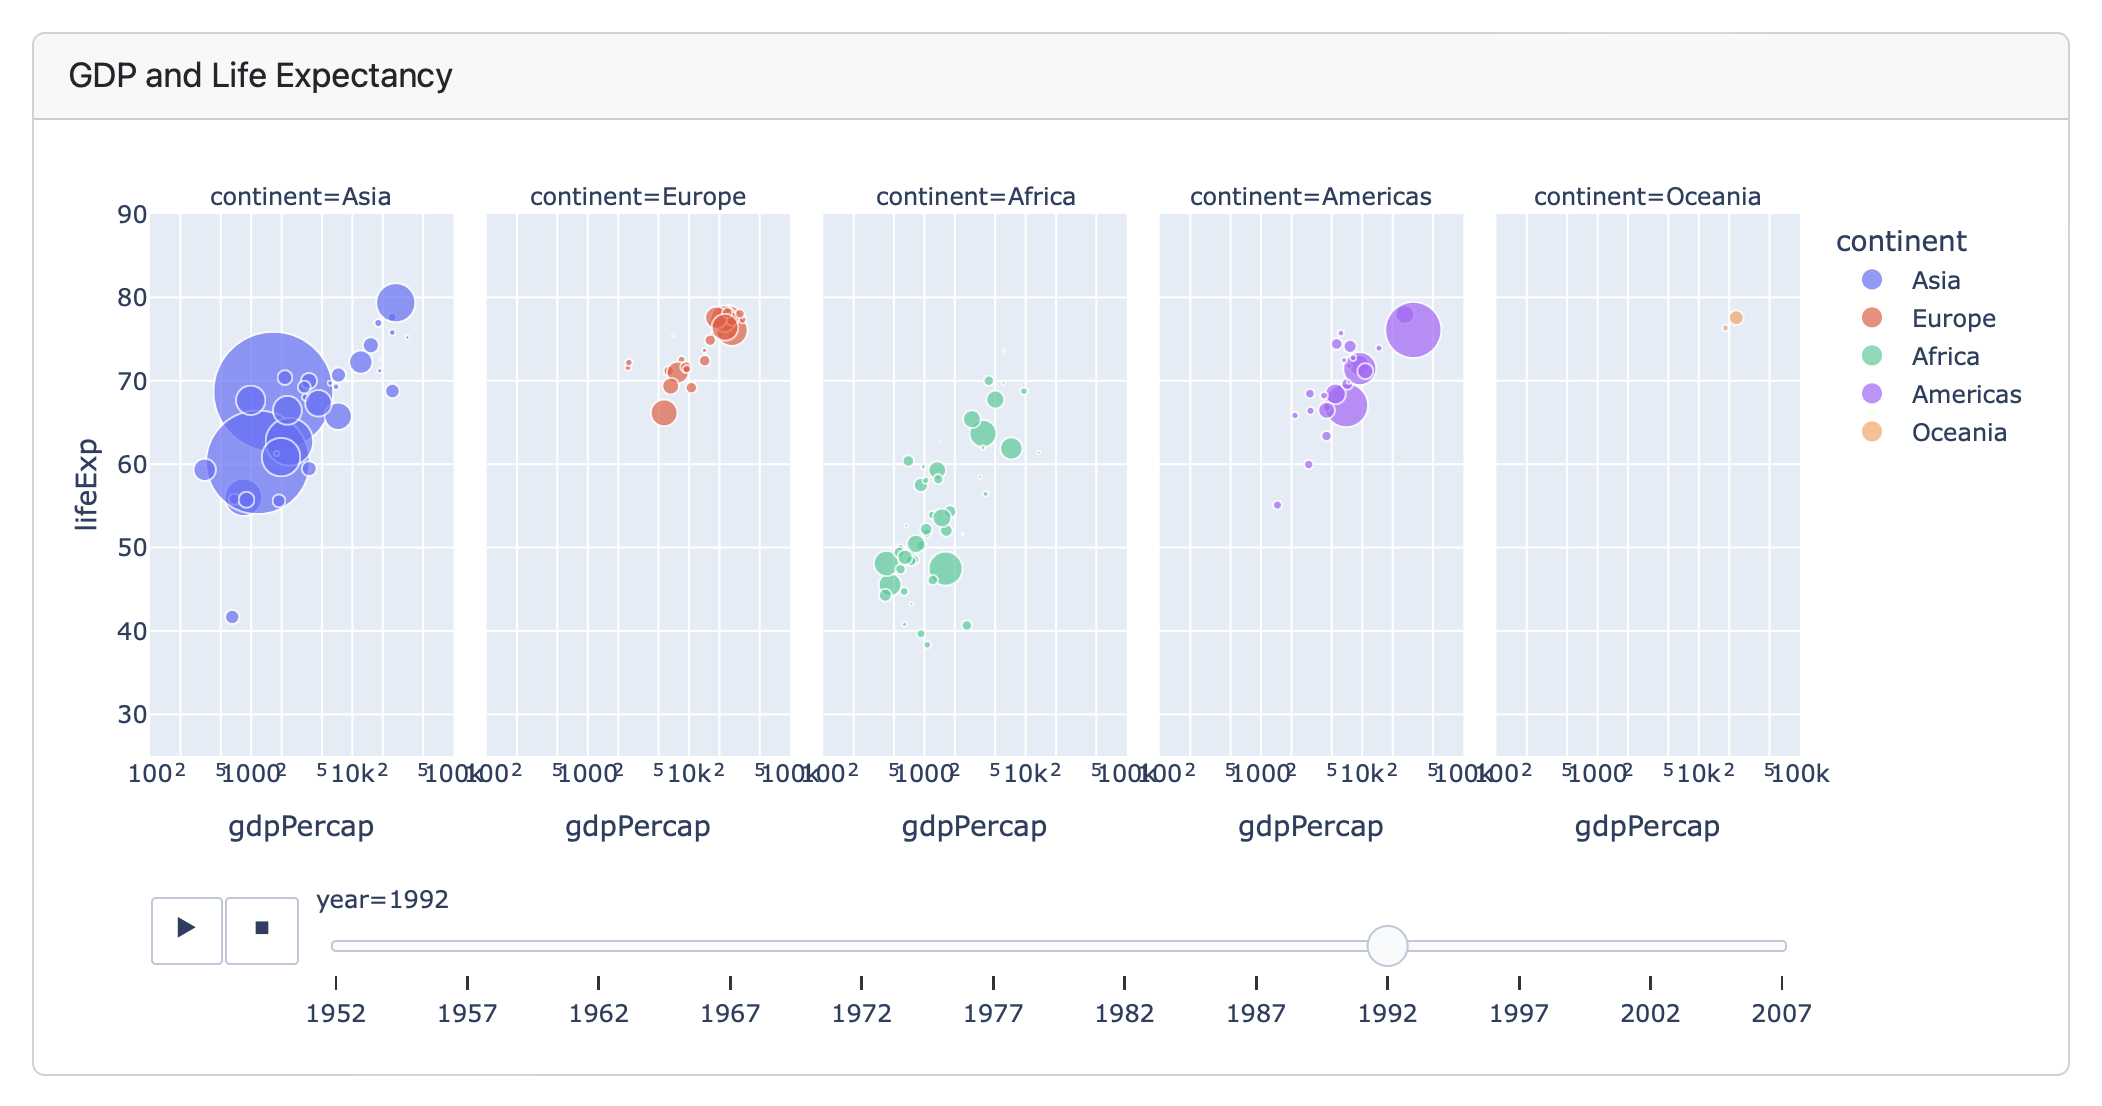
Plots
```{python}
#| title: GDP and Life Expectancy
import plotly.express as px
df = px.data.gapminder()
px.scatter(
  df, x="gdpPercap", y="lifeExp",
  animation_frame="year", animation_group="country",
  size="pop", color="continent", hover_name="country",
  facet_col="continent", log_x=True, size_max=45,
  range_x=[100,100000], range_y=[25,90]
)
```
Tables
Value Boxes
## Row

```{python}
#| component: valuebox
#| title: "Current Price"
dict(icon = "currency-dollar",
     color = "secondary",
     value = get_price(data))
```

```{python}
#| component: valuebox
#| title: "Change"
change = get_change(data)
dict(value = change['amount'],
     icon = change['icon'],
     color = change['color'])
```
Text Content
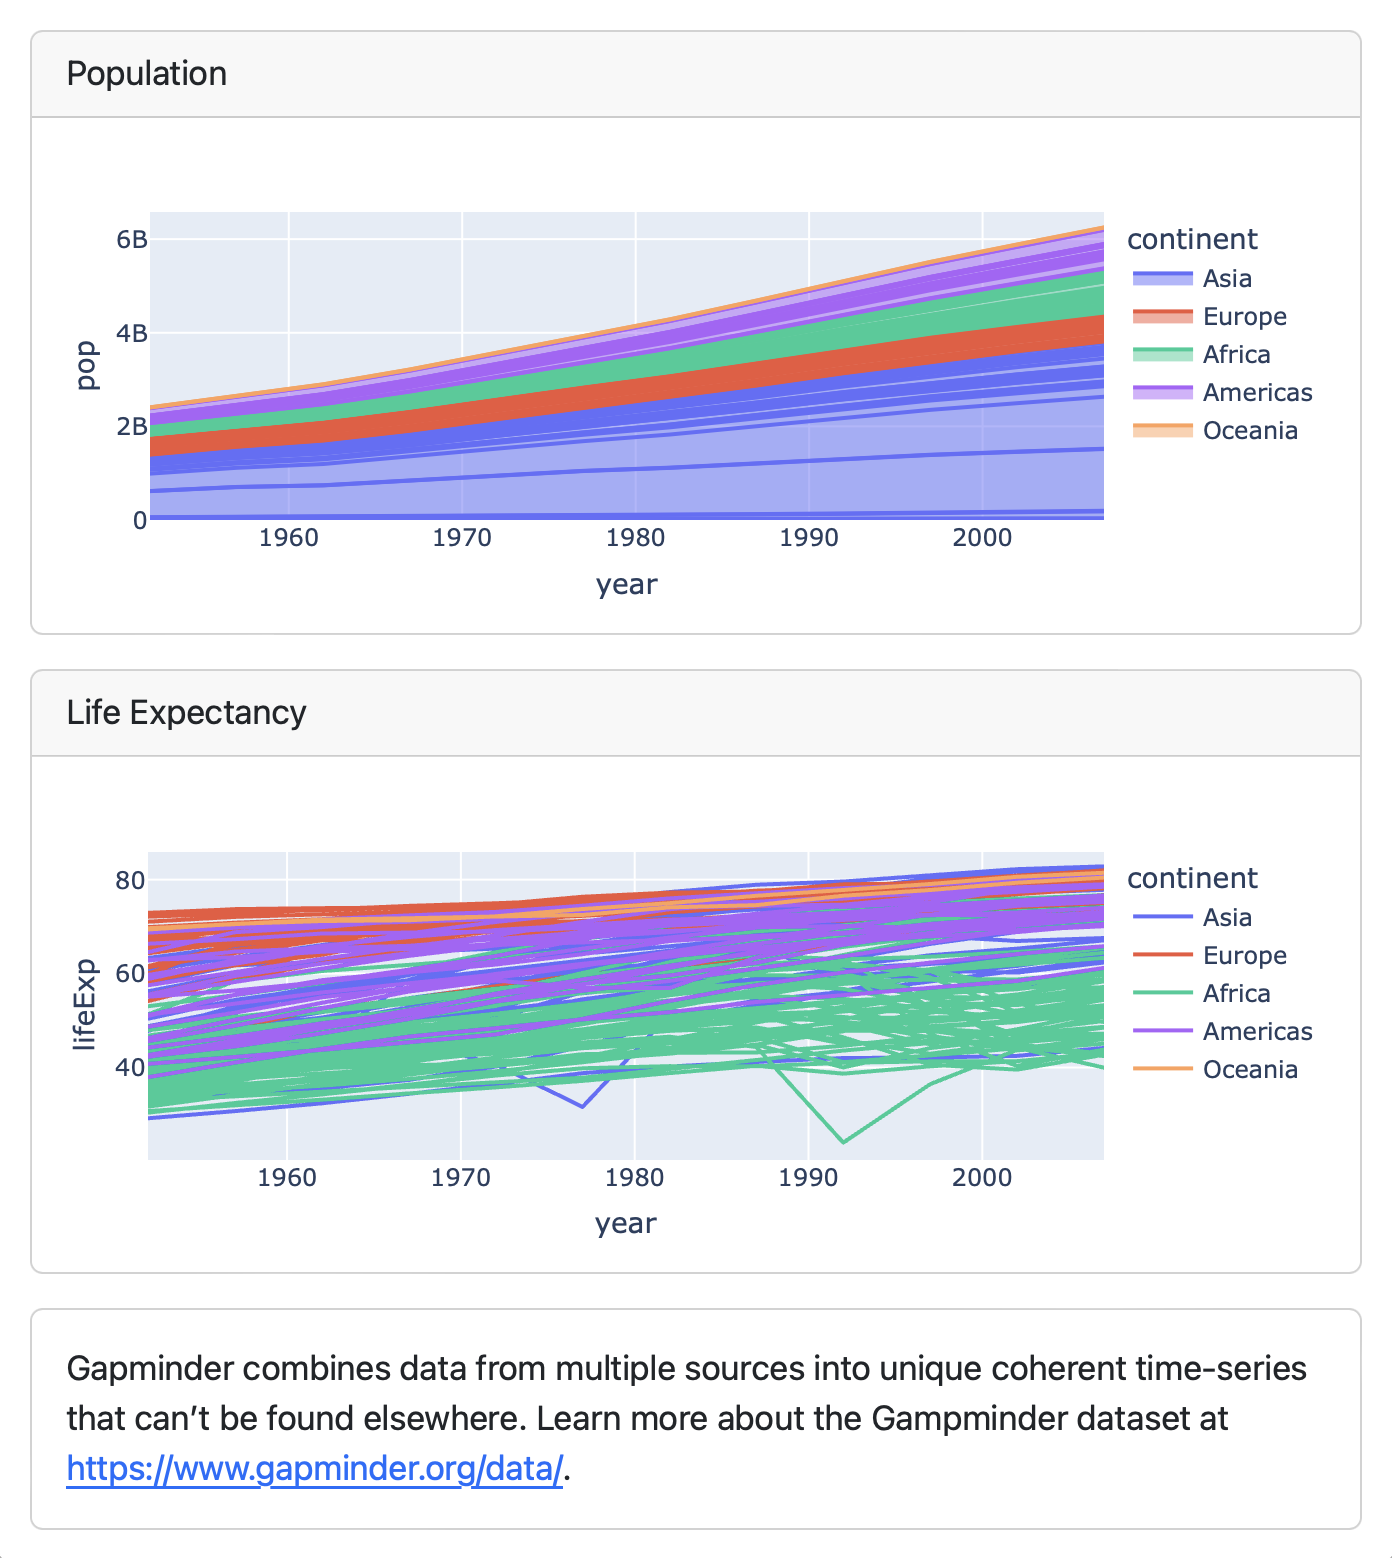
## Column

```{python}
#| title: Population
px.area(df, x="year", y="pop",
        color="continent",
        line_group="country")
```

```{python}
#| title: Life Expectancy
px.line(df, x="year", y="lifeExp",
        color="continent",
        line_group="country")
```

::: {.card}
Gapminder combines data from multiple sources
into unique coherent time-series that can’t be
found elsewhere. Learn more about the Gampminder
dataset at <https://www.gapminder.org/data/>.
:::
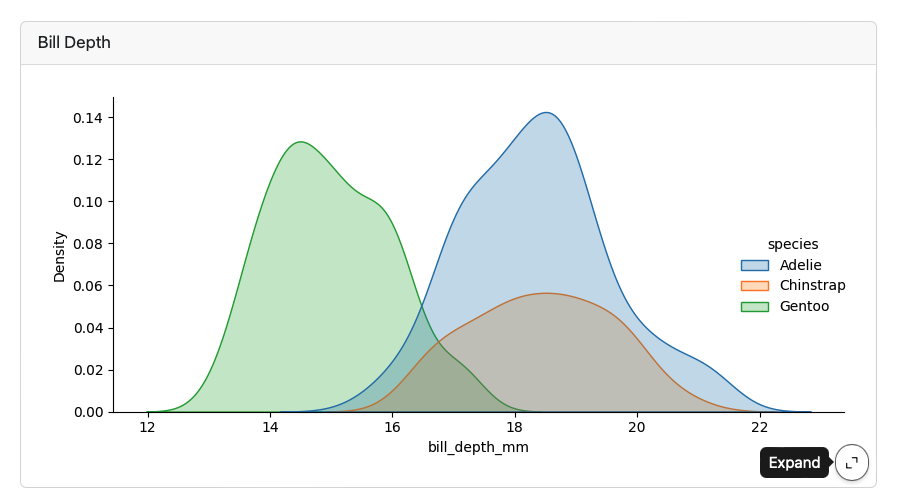
Expanding Cards
Cards provide an Expand button which appears at bottom right on hover:
Dashboard Deployment
Dashboards are typically just static HTML pages so can be deployed to any web server or web host.
| Static | Rendered a single time (e.g. when underlying data won’t ever change) |
| Scheduled | Rendered on a schedule (e.g. via cron job) to accommodate changing data. |
| Parameterized | Variations of static or scheduled dashboards based on parameters. |
| Interactive | Fully interactive dashboard using Shiny (requires a server for deployment). |
Parameterized Dashboards
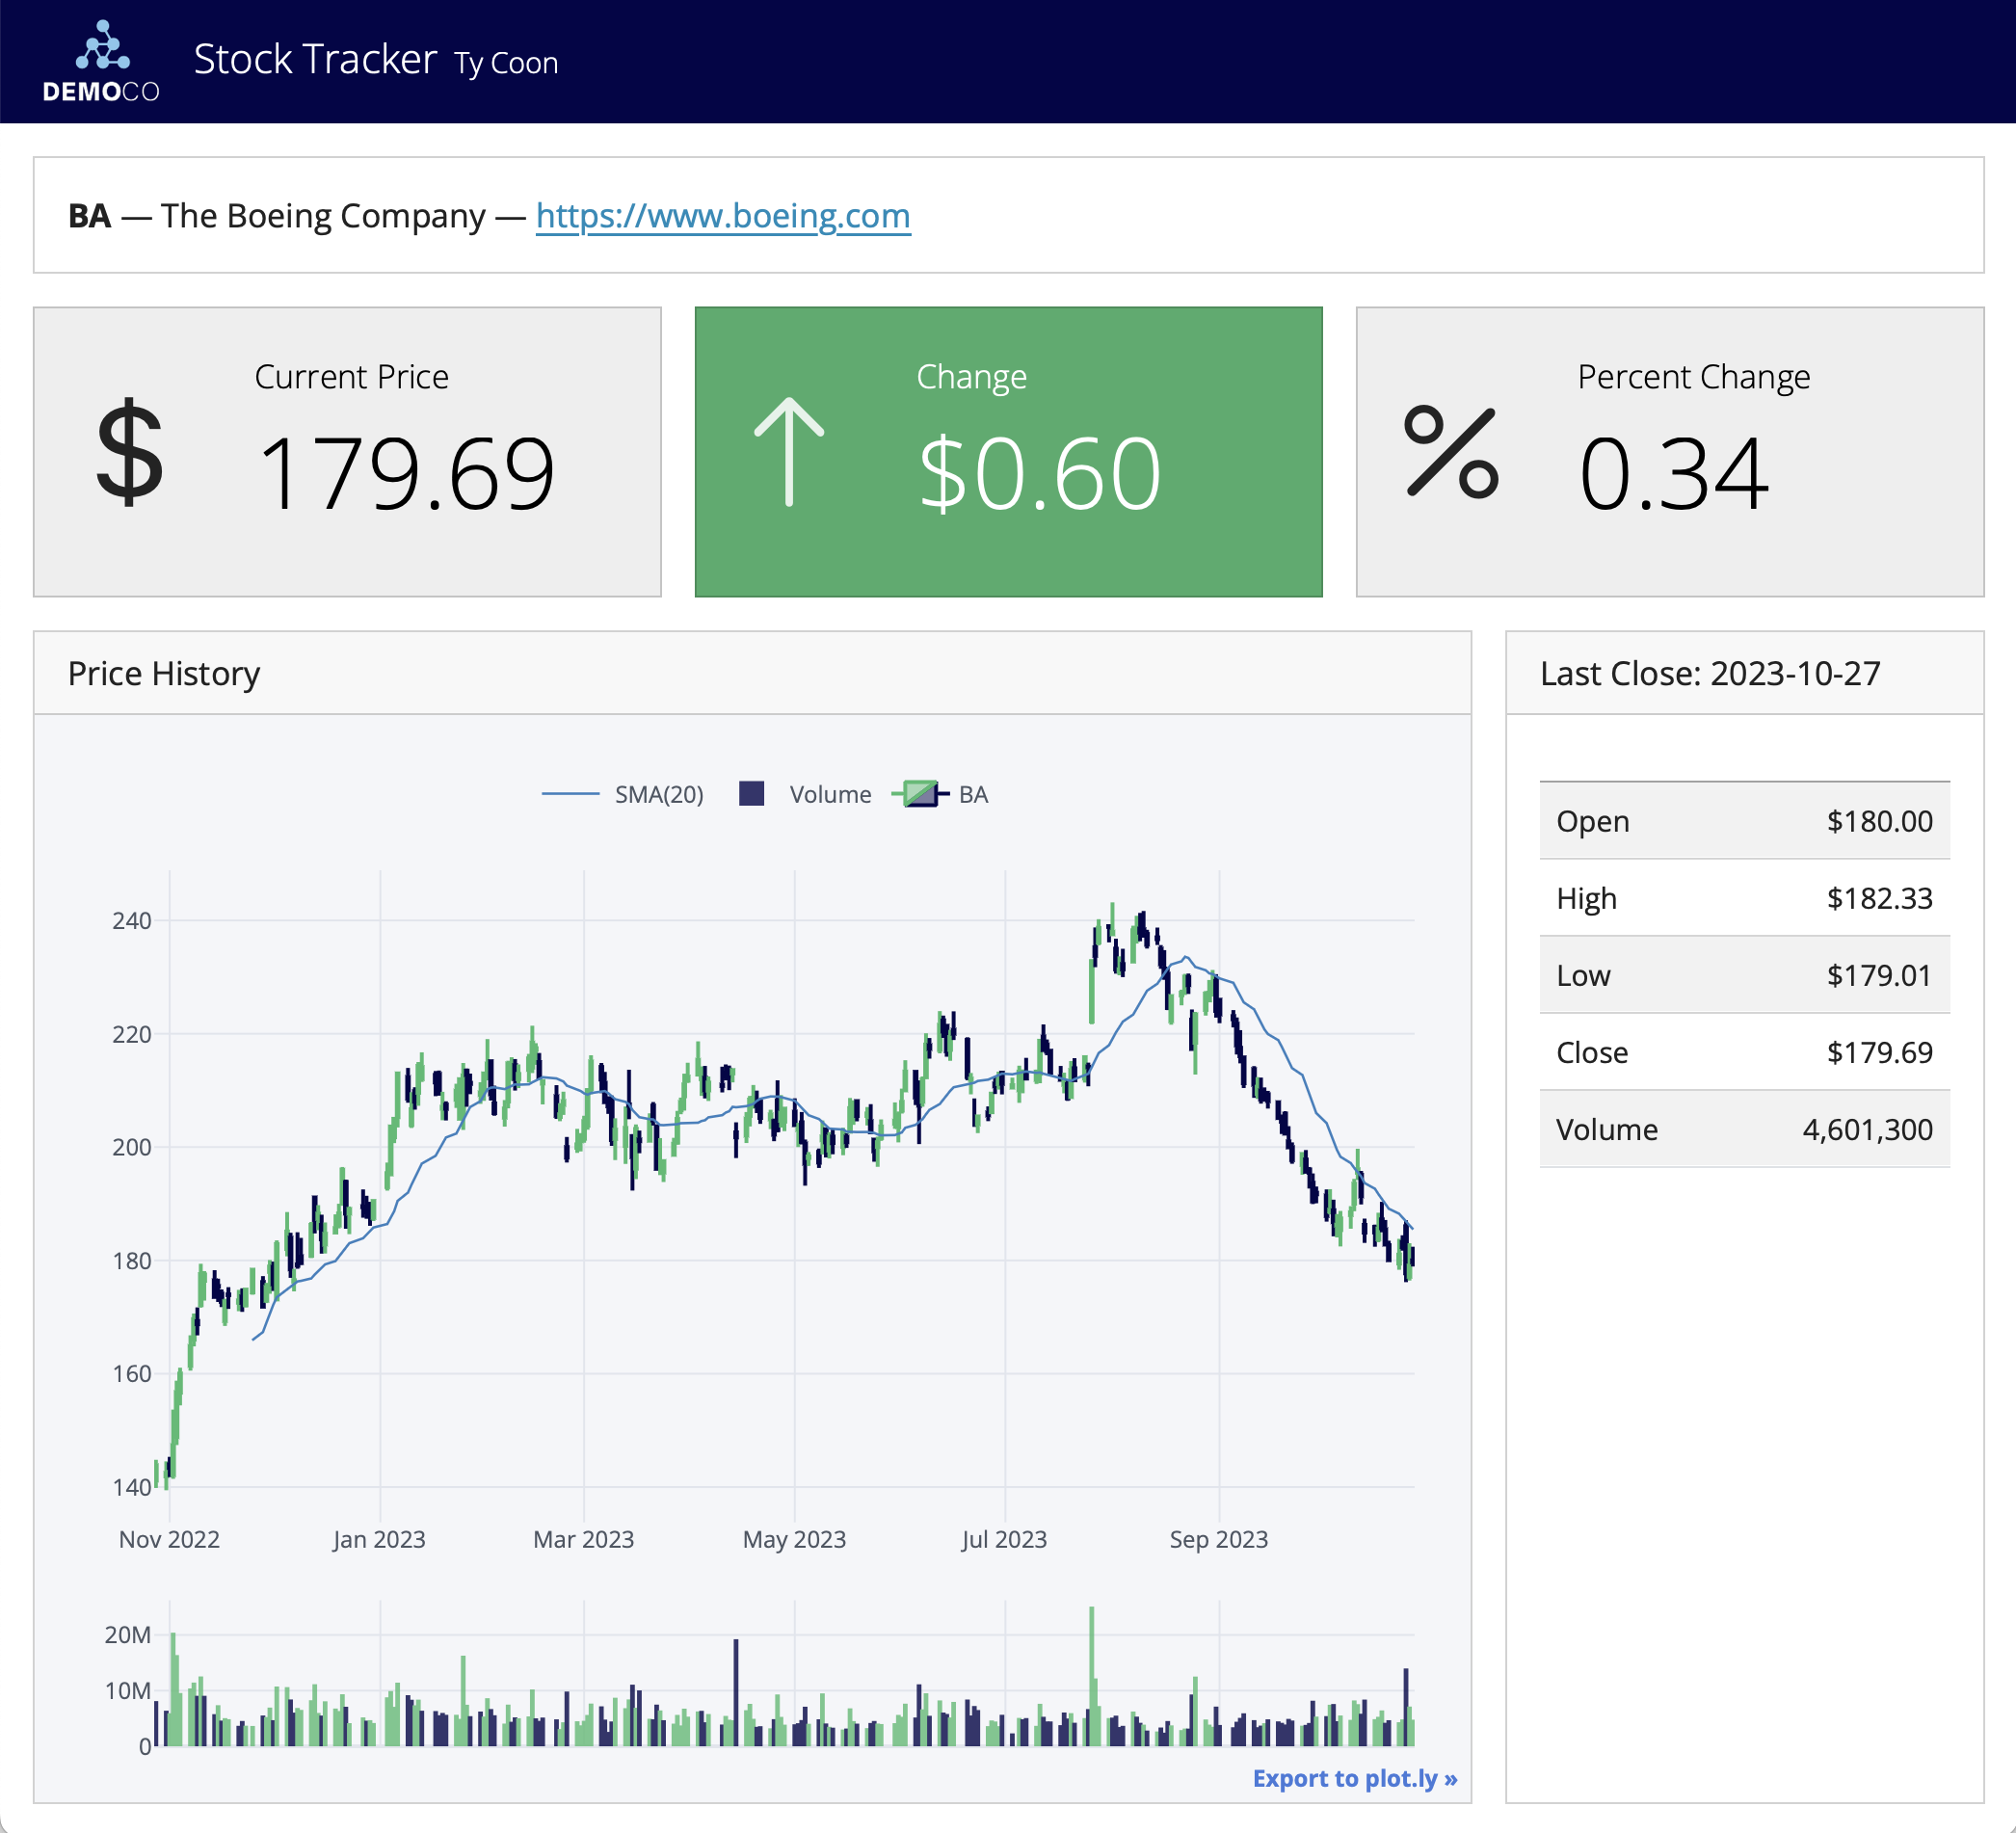
Add a parameters tag to the first cell (based on papermill) :
Use the -P command line option to vary the parameter:
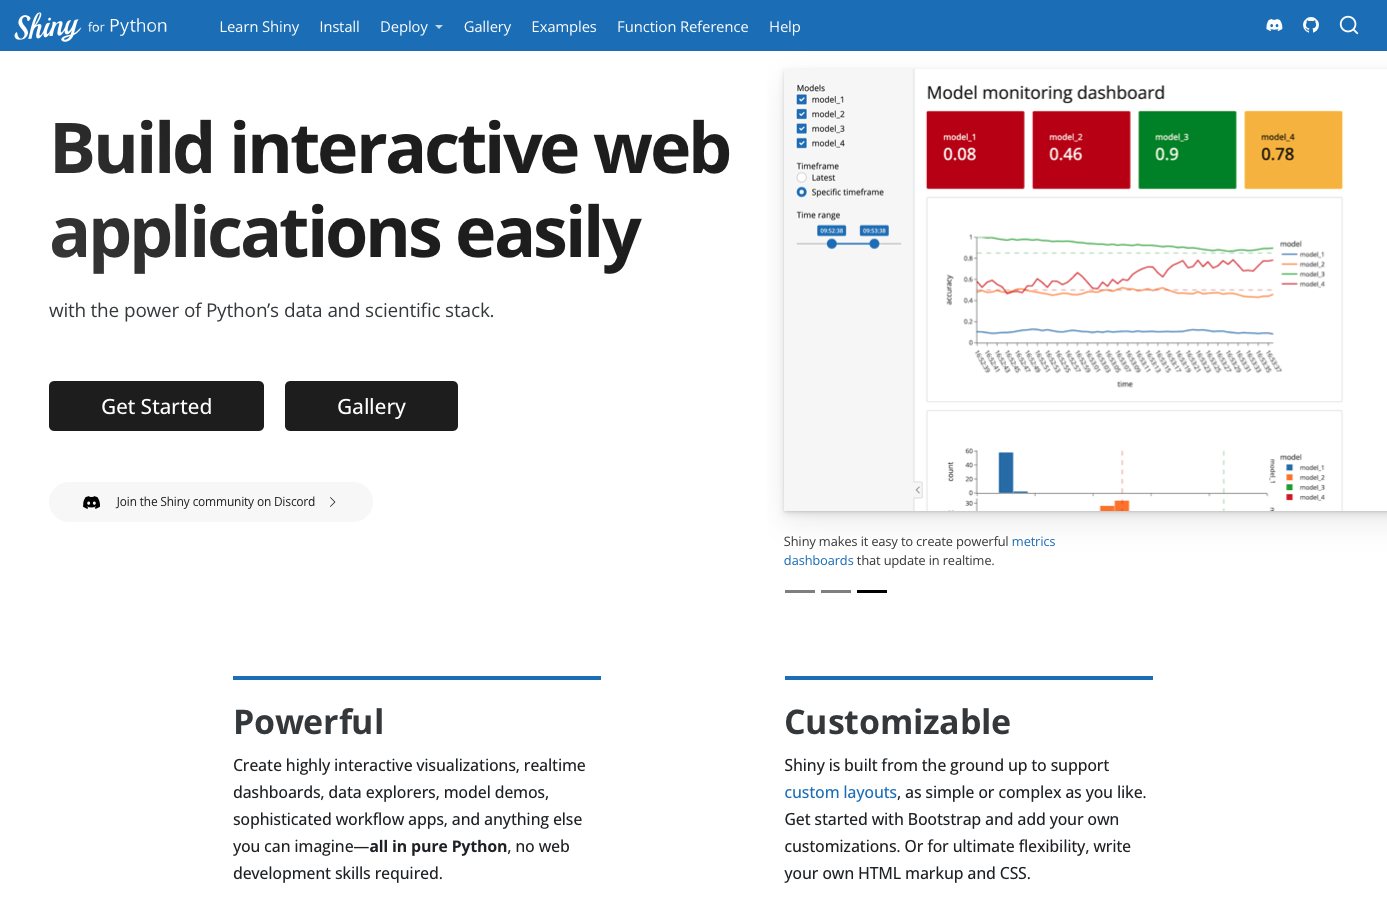
Interactive Dashboards
https://quarto.org/docs/dashboards/interactivity/shiny-python/
For interactive exploration, some dashboards can benefit from a live Python backend
To do this with Quarto Dashboards, add interactive Shiny components
Deploy with or without a server!
Deployment of Interactive Dashboards
Server
On-Prem
- Shiny Server (open source)
- Posit Connect (commercial)
- Roll your own
Wrap up
Learn more
Questions
Any questions / anything you’d like to review before we wrap up this module?
